Fermentation Batch Deviation Investigation: DO Spikes, pH Drift, Growth Lag and Unexpected Feed Even
2026-10-16 16:40:07A Practical Root-Cause Workflow for Bioreactor Process Data
A batch does not fail at the moment the graph looks strange
A fermentation batch can appear healthy for hours and then show a sudden dissolved oxygen (DO) spike, rising acid/base consumption, a slower-than-expected biomass increase, or an apparent change immediately after feeding. These signals are useful precisely because they are incomplete. A trend reports what a sensor or controller observed; it does not, by itself, identify whether the culture changed, the measurement changed, or the process equipment changed.
A reliable fermentation deviation investigation reconstructs the sequence of events before naming a root cause. At OLLITAL, we recommend keeping four evidence streams together: recorded process values, commanded and actual equipment actions, independent laboratory measurements, and the physical state of the vessel and utilities. Investigating only one stream can produce an apparently convincing but incorrect explanation.
This guide is written for fermentation engineers, laboratory managers and equipment buyers working with controlled glass or stainless-steel bioreactors. It is not a universal corrective-action recipe. Permitted adjustments, alarm responses, containment and any decision to continue a run must follow the site’s approved operating and biosafety procedures.
What counts as a meaningful deviation?
A deviation is a departure from an expected or approved operating condition, observation, or process outcome. It is not limited to a red alarm. A batch can remain inside every configured setpoint yet drift away from its normal substrate uptake, biomass trajectory or product profile. Conversely, an isolated DO peak may reflect a sampling disturbance or a brief controller event without establishing a biological process failure.
Define the comparison first: the approved process range, the expected phase of culture growth, the prior qualified batch behavior, and the actual instrumentation configuration. A raw comparison of two curves is weak if the media differ, sensor calibration has changed, sampling frequency is inconsistent, or the planned feed was delivered at a different concentration.
Do not silently change a batch target because the graph is inconvenient. Record the event against the agreed limit or observation criterion, including when it began, how long it persisted, what action followed, and whether a product-quality or contamination concern may be implicated.
Build a time-aligned event record before interpreting the signals
The most productive starting point is to establish a single, traceable event timeline. For each notable change, capture the actual timestamp, the active control setpoint, the measured value and any operator or controller action occurring nearby. A graph labeled “hour 18” is insufficient when the pump log uses local clock time, the controller saves intervals and an independent lab result carries the time of sample analysis rather than sample collection.
For DO anomalies, align the DO signal with agitation, airflow, oxygen enrichment if configured, and vessel pressure where recorded. For a pH deviation, add acid/base pump demand, titrant identity, media additions and any sensor-calibration activity. For growth delays, add inoculum age, culture volume, substrate assays, sampling events, and temperature history. These are not separate checklists: they are the same batch story viewed from different angles.
The difference between commanded pump speed and actual delivered mass deserves special attention. A controller may record a scheduled pump command while a tube is worn, a line is blocked, a bottle is empty or a balance is disconnected. Use an independent delivery check or an approved reconciled inventory record where possible; do not assume a pump command equals a delivered feed volume.
First investigation gate: trust the measurement, but verify it
Before attributing an unusual value to the culture, check whether the measurement system was working inside its qualified range. For DO, inspect the sensor status, calibration history, response time, cable and connector condition, and whether a sudden aeration or agitation change could disturb the local measurement. For pH, review slope/offset status where recorded, probe age, fouling potential, reference-electrolyte condition where applicable, and recent sterilization or cleaning exposure.
An apparent abrupt change immediately after a sensor replacement or cable intervention has a different evidentiary weight from a steady drift that coincides with changing base consumption and an independently confirmed assay. Neither should be dismissed automatically. Resolve instrument questions through approved checks that do not compromise a sterile, pressurized or hot process boundary.
Independent samples can strengthen the investigation, but only when the sample identity, collection method, sampling time, transport and analytical method are controlled. A delayed off-line measurement is not interchangeable with an instantaneous on-line reading. Differences may arise from sample handling, temperature and gas exchange, not just from failure of one measurement.
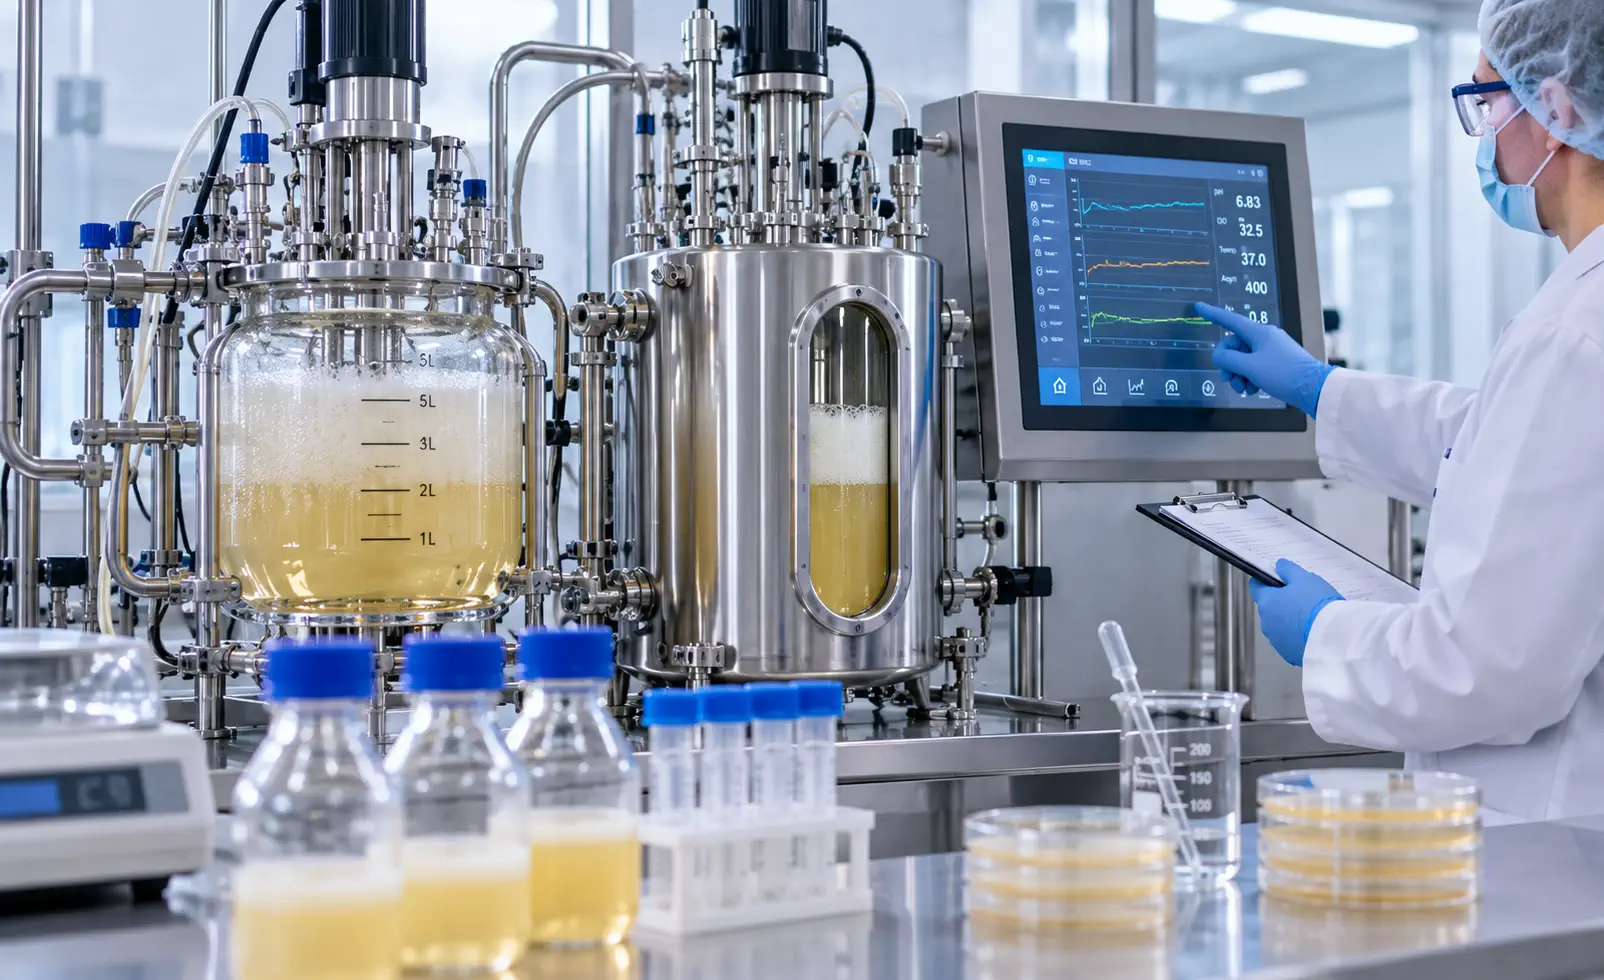
Figure 1. Conceptual process-review scene. Cross-check sensor trends against operator logs and independent sample records; displayed values and equipment are illustrative, not a real OLLITAL batch.
Reading DO spikes without making the wrong diagnosis
A DO spike indicates that measured dissolved oxygen increased relative to its recent state. It does not automatically mean the vessel gained oxygen-transfer capacity. In an aerobic culture, the signal may rise when cells consume less oxygen, when feed or another limiting substrate runs short, when aeration or mixing changes, or when the probe response changes. Some explanations can occur together.
A useful way to narrow the possibilities is to ask what moved first. If the feed pump stopped before the DO rise and the biomass trend later slows, substrate limitation becomes a plausible hypothesis. If the agitation cascade stepped up before the change while feed delivery remained stable, a transfer-side explanation deserves review. If the plot jumps discontinuously at the instant a cable was manipulated, investigate instrument integrity before inferring a biological transition.
In each case, test the hypothesis against airflow and gas control records, pump totals, relevant offline substrate data, and growth or activity evidence. Avoid treating a single DO spike as a universal trigger to increase or stop feeding. Under some culture conditions, an unverified feed correction may make the original disturbance worse.
When DO falls instead of rises
An unexpected DO decline is also ambiguous. Oxygen uptake may have increased during growth or after nutrient addition, but oxygen transfer may also have fallen because of lower airflow, changing broth rheology, foam interaction, a gas-supply issue or a mixing limitation. Instrument fouling or an inappropriate calibration state can produce misleading responses.
Distinguish oxygen demand from oxygen delivery using the controls the specific bioreactor actually records. Compare measured DO with agitation demand, airflow, enriched-gas commands when present, working volume, antifoam events, feed additions and temperature. A controller at its authorized upper limit may no longer have spare transfer capacity, even when its setpoint display still looks normal.
If the pattern points to a potentially unsafe or uncontrolled condition, use the approved deviation procedure rather than improvising changes to oxygen or gas supply. This investigation framework supports understanding; it does not authorize changes outside the configured control or safety envelope.
pH drift: a biological signal or a control-system signal?
A gradual pH drift can reflect changes in microbial metabolism, substrate chemistry, accumulation of acidic or alkaline species, carbon dioxide behavior, or buffering capacity. It can also arise from incomplete reagent delivery, probe calibration drift, mixing delays, or sensor response effects. A stable pH readout can even mask a developing problem if the acid/base pump works progressively harder to hold the same setpoint.
Look at both the pH curve and the cumulative correction demand. Check acid/base bottle identity and concentration, tubing condition, dose commands, actual consumption, and the proximity of addition points to the sensor. Where an appropriate independent pH measurement is available, interpret the difference with attention to collection time and sample handling.
Consider a batch in which the controller keeps pH on target while base addition increases steadily. That pattern does not justify calling the batch “unchanged.” It is an observation that the process or correction requirement shifted. Whether that shift is expected depends on the organism, feed formulation, metabolic stage and previously established operating history.
Growth lag: validate the biology before blaming the vessel
Slower-than-expected growth is frequently discovered from sample results rather than a controller alarm. Before blaming a bioreactor, examine inoculum quality and age, initial viable biomass, medium preparation, true working volume, sterilization and inoculation history, substrate availability, and the actual time of sampling. Compare like with like: optical density, dry-cell weight, viable count and off-gas activity describe related but different properties and may be affected differently by foam, aggregation or changes in morphology.
A late or inconsistent sample can make the apparent start of growth seem delayed. An optical-density reading from a flocculating culture can also disagree with a dry-mass measurement, even though the culture is metabolically active. The appropriate response is to verify the analysis and examine a coherent set of observations, not to assume the temperature, impeller or motor requires replacement.
Where oxygen limitation is plausible, review the historic DO and agitation/gas-demand pattern together with culture samples. Where nutrient limitation is plausible, check the actual composition and delivery of medium or feed. Where contamination is suspected, follow the approved microbiological investigation process; trend patterns alone cannot confirm contamination identity.
Unexpected feed events: reconstruct what truly entered the vessel
Feed discrepancies are a common source of difficult investigations because the process state changes after the event, while the feed system may leave an incomplete trail. A pump command is an input; delivered feed is an outcome. Compare programmed schedule and actual operation against bottle weights or independent metering, pump calibration, tubing condition, line hold-up, clamps, leaks and any manual interventions.
Liquid preparation details also matter. Two batches may deliver the same nominal liters but different masses of substrate if solution concentration differs. A switching event can introduce air, lose prime or leave material in a hose. In addition, the delivered stream may not reach the bulk liquid uniformly if the mixing or inlet arrangement differs across vessel scales.
Use the approved mass-balance method to reconcile planned and actual additions. If the record is insufficient, document that gap as an unresolved uncertainty rather than calculating a confident nutrient uptake rate from commanded pump rpm alone.
Do not confuse controller response with process cause
Closed-loop control creates a specific interpretation trap: an output can move because the controller is compensating for something else. Rising agitation after DO begins to fall may mean the DO cascade is doing its job, not that stirring caused the original oxygen deficit. Increased base pumping can be a response to metabolic acid production rather than the cause of the pH change. A cooling-valve movement can be a reaction to heat release instead of its source.
To avoid reversing cause and effect, compare the first detectable measured deviation, the controller algorithm and mode, the relevant setpoint, the output command, the actuator response, and the independent process evidence. Record whether the loop was automatic, manual, in transition, or at a configured limit. When a signal is logged more slowly than the true event, apparent order on a plotted graph can be misleading.
A practical first-pass investigation matrix
Observation | Possible evidence to check | What it cannot prove alone |
|---|---|---|
DO rises suddenly | Feed stoppage, agitation and gas records, calibration or disturbance log, substrate samples | That feed starvation is the only cause |
DO drops abruptly | Agitation/air commands, gas availability, foam, culture activity, probe response | That the culture always increased oxygen uptake |
pH control demand rises | Acid/base inventory, pump calibration, formulation, pH check, dosing record | That the probe is faulty or metabolism changed without other evidence |
Growth lags | Inoculum status, sample timing, biomass method, nutrient supply, DO/temperature history | That vessel mixing is necessarily inadequate |
Delivered feed unclear | Pump command, bottle weights, tubing, line state, actual flow check | That commanded rate equals delivered substrate |
Table 1. A first-pass evidence map for engineering review. It is a diagnostic framework, not proof of a root cause or an automatic operating procedure.
Compare batches by shared time references, not by visual similarity
Batch comparison is most useful when all runs are aligned to a meaningful event: inoculation, beginning of fed-batch, an induction step or another documented phase transition. Overlaying curves by raw wall-clock time can create false differences when one run started late, sampled differently, or recorded at a different interval. Comparisons should show critical events and sampling times rather than presenting tidy but context-free plot lines.
Before concluding that Batch B is worse than Batch A, reconcile inoculum history, media lot and preparation, vessel working volume, gas settings, feed composition, calibration state and any operator actions. Compare the actual outcome measure, not only the controller’s ability to hold pH or DO within limits. A batch with smooth DO control is not automatically a better batch if growth or product performance is inferior.
A defensible comparison also preserves negative evidence: sensors that passed checks, feed totals that reconcile, and independent assays that disagree with the favored hypothesis. Those details help prevent repeated investigations from converging on the same convenient but unsupported explanation.
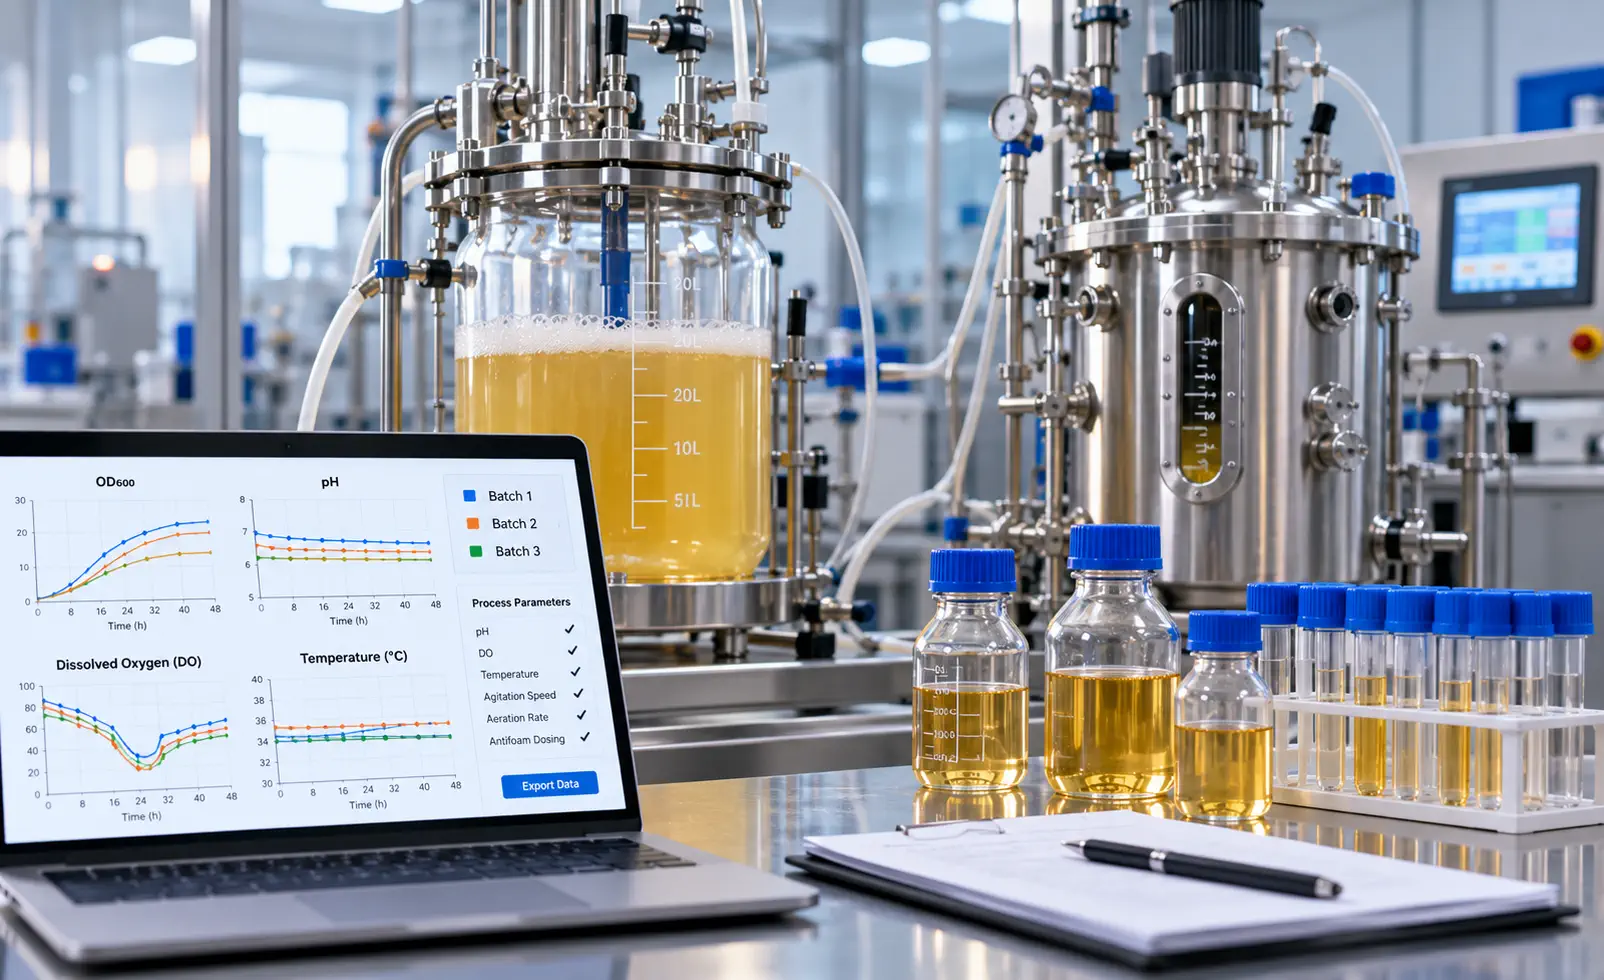
Figure 2. Illustrative batch-review workstation. Use real exported trends and independently verified samples when evaluating batch-to-batch differences; visible dashboard curves are not OLLITAL trial data.
What should be included in a usable electronic batch review?
The batch package should allow another engineer to reconstruct the event without relying on the memory of the operator who was on shift. At minimum, include a unit and batch identifier; medium/feed identities; calibration status; inoculation and key step times; the initial and final working volumes; setpoints and measured values; control modes; alarms; pump/gas actions; manually entered interventions; laboratory sample records; and the disposition of the event.
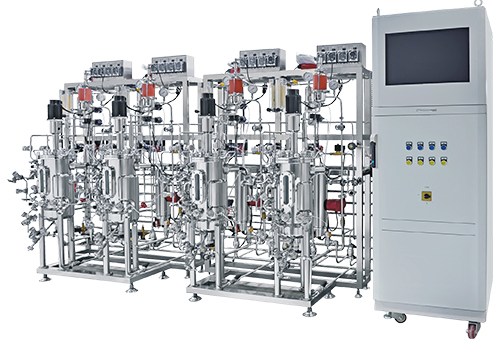
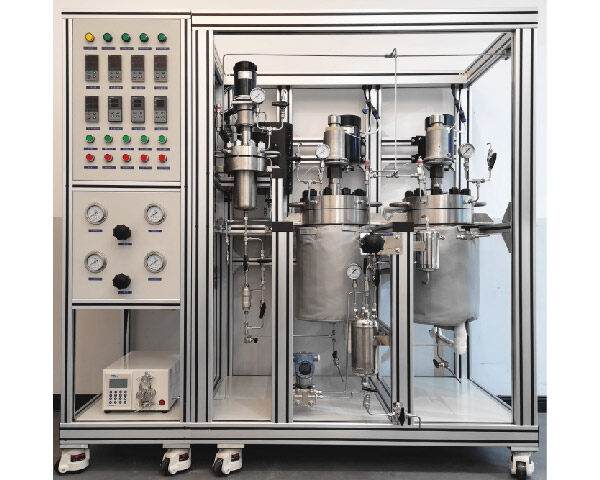
The level of automation varies by configuration. OLLITAL’s Laboratory Small Glass Bioreactor Fermenter (OLT-100-M1) page lists pH, DO, temperature, agitation, pump and gas-related controls and a USB data-export interface. The Stainless Steel Bioreactor Fermentor (OLT-500-C1) page lists similar controls and an industrial-PC control tower with USB data export. Those published descriptions do not, by themselves, establish the same logging interval, alarm historian, electronic signatures or audit-trail capability for every purchased unit.
When batch traceability or formal electronic records are required, ask what is actually stored versus displayed, which values are recorded automatically, how time is synchronized, how long history is retained, how exports are identified, and which changes can be reconstructed later. These functions need to be verified for the specific controller and ordered software version, not assumed from a screen image on a website.
A decision-oriented handover at the end of an investigation
A good investigation ends with a clear statement of what is known, what remains uncertain, and which decisions follow. That can mean an instrument-service request, adjustment of a validated sampling plan, investigation of feed-line integrity, a revised observation criterion, or a request for engineering review of the process hardware. The team should identify the evidence required to demonstrate that any approved corrective action works before treating the issue as closed.
Do not turn every outlier into a new recipe. Some actions address data quality, some improve operator discipline, and some require equipment modification. They have different validation and documentation consequences. Treat process changes, instrument changes, and data-record changes as separate decisions, even when they arise from one batch event.
Using these findings when specifying an OLLITAL bioreactor
At OLLITAL, we can use a structured deviation report to discuss the configuration needed for future runs. A buyer may need more reliable pump-flow verification, an additional sampling connection, clearer gas-cascade logging, additional probe provisions, or a different historian/export arrangement. The correct answer depends on the organism, process risk and current equipment configuration; it should not be inferred from the model name alone.
For project planning, start with the OLLITAL Bioreactor & Fermentation range and identify the glass or stainless system that matches your working volume and sterility requirements. Then bring representative trends, the event chronology, feed-delivery evidence, gas and agitation records, sampling results and your intended data-retention needs to the engineering discussion. That package makes the conversation more productive than a request for “a reactor with better control.”
Conclusion: investigate the event, not the most dramatic curve
A sudden DO rise, unexplained pH correction or slower growth phase is a starting point for investigation, not a diagnosis. The strongest fermentation process troubleshooting combines time-aligned sensor data, actual equipment actions, independent sample evidence and process context. Separate signal reliability from control response, and control response from biological cause. Only then is it reasonable to determine what should change in the recipe, the instrument, the operating procedure or the hardware.
Need to review a recurring fermentation deviation or specify better process records? Send OLLITAL the working volume, organism, current control variables, event timeline, representative batch trends, pump/gas history and any relevant analytical results through Contact OLLITAL. We can use those details to review configuration and measurement needs against the actual application, without promising that one equipment change will resolve every process deviation.