Off-Gas Analysis in Microbial Fermentation: How to Interpret OUR, CER and RQ in Bioreactor Process D
2026-10-15 17:29:41A CO₂ curve is not a growth curve
A rising exhaust CO₂ signal often looks convincing. The culture appears to be respiring more strongly, so the operator assumes growth is improving. Yet the same trend can follow a change in gas flow, an increase in carbon feed, a shift in CO₂ stripping, or a mismatch between the analyzer reading and the actual gas leaving the vessel. The curve matters; the story assigned to it can be wrong.
For microbial fermentation, off-gas analysis becomes useful when it is interpreted together with dissolved oxygen (DO), inlet-gas composition, gas flow, pressure, feeding and the batch record. The measurement is not a stand-alone productivity meter. This guide explains what oxygen uptake rate (OUR), carbon dioxide evolution rate (CER) and respiratory quotient (RQ) can reveal, how to avoid the common traps, and what hardware an engineer should confirm before specifying a bioreactor analytics package.
Quick answer: what do OUR, CER and RQ mean?
OUR is the rate at which a culture takes up oxygen, normally calculated from inlet and outlet gas molar-flow balances and expressed per time or, when normalized, per reactor liquid volume. CER is the corresponding rate of CO₂ release. RQ is the ratio CER/OUR on a consistent molar basis. These are derived process variables—not simply the percentages shown on an oxygen or carbon dioxide analyzer. They become meaningful only when the gas measurements, flow rates and time alignment are reliable.
The measurement starts at the exhaust, not the software screen
Inside the vessel, oxygen transfers from bubbles to liquid and is consumed by the organisms. CO₂ is formed through metabolism, distributes between liquid and gas phases, and eventually leaves through the exhaust. What the analyzer sees is the gas-phase result of several simultaneous processes. A dissolved-oxygen probe sees the local liquid-phase balance; an off-gas analyzer observes the departing gas composition. Neither alone provides the complete mass balance.
A practical off-gas arrangement can involve a sterile exhaust path, moisture or condensate management, sample conditioning where appropriate, tubing that does not distort the intended measurement, gas measurement channels and a way to relate the result to inlet flow and culture conditions. Actual equipment configuration varies. A line that is clean enough to carry exhaust is not automatically suitable for accurate quantitative gas analysis, especially when water vapor or condensation can alter the sampled stream.
Read the three signals separately before combining them
OUR: oxygen consumption, not an isolated DO setpoint
OUR describes how rapidly oxygen is being removed from the gas entering the process, subject to the defined balance and measurement assumptions. In an aerobic culture, a rising OUR can accompany greater biomass and metabolism. It may also reflect a change in physiological state after feeding. A stable DO percentage does not imply stable OUR: the controller might be raising agitation, enriching inlet oxygen or changing airflow to compensate for higher uptake.
CER: CO₂ evolution, not a direct yield guarantee
CER can respond to carbon metabolism, growth state and changes in substrate supply. But observed exhaust CO₂ can also be influenced by dissolved inorganic carbon, pH-driven CO₂ speciation, changing broth conditions, gas stripping and analyzer lag. A brief CER increase is therefore not proof that product formation has increased. It is an observation requiring context.
RQ: a helpful ratio with important limits
When OUR is sufficiently above the instrument uncertainty, RQ = CER / OUR can support discussion of broad metabolic changes. However, there is no universal “healthy RQ” for every organism or substrate. Product synthesis, substrate composition, acid-base chemistry, oxygen limitation and gas-balance assumptions all affect interpretation. RQ becomes particularly unstable or misleading when OUR approaches zero, or when the two rate estimates contain different timing errors.
Why dry-gas basis and molar flow matter
An O₂ reading of 18% and a CO₂ reading of 3% cannot by themselves determine uptake or evolution rates. The balance needs inlet and outlet gas quantities expressed on a compatible basis. If humid exhaust is analyzed without appropriate correction, water vapor changes apparent dry-gas composition. Meanwhile, CO₂ production and O₂ consumption can cause the outlet molar flow to differ from the inlet flow. Using inlet volumetric flow as if it were the outlet flow can produce a systematic bias.
A sound calculation therefore documents whether the analyzer reports wet or dry gas, the flow-measurement reference conditions, pressure, temperature, gas composition and the conversion to consistent molar rates. Researchers may use an inert-gas balance or appropriately measured outlet flow to resolve differences. The valid method depends on the installed instrumentation and the process. The important procurement question is whether the proposed system supplies enough information to make a defensible calculation.
| Signal or record | Needed for interpretation | Common mistaken assumption |
|---|---|---|
| Inlet gas flow and composition | O₂ entering the vessel; gas changes during the run | Airflow is unchanged when enrichment starts |
| Exhaust O₂ / CO₂ | Gas fractions on a stated wet or dry basis | The percentages are OUR and CER |
| Outlet flow or balance method | Converts composition to molar rates | Inlet and outlet molar flows are equal |
| DO, rpm and aeration history | Separates demand changes from transfer response | Steady DO means steady metabolism |
| Sampling conditions and timestamps | Accounts for water, lag, drift and alignment | Every point on each trace is simultaneous |
Sampling-path integrity can dominate the measurement error
The off-gas line is the first place to look when the process graph becomes implausible. Condensation can intermittently obstruct a sample line or change analyzer response. An exhausted filter, a liquid trap, an unintended air leak or a changing sample pump rate can all alter what reaches the sensor. A pressure change can also affect instruments that are not compensated for their intended range.
The line must be assessed against the equipment manufacturer’s approved arrangement and the facility’s sterile-boundary rules. An exhaust sample path can contain potentially hazardous or biologically active material. It should not be opened, bypassed or modified during a run simply to make an analyzer reading look normal. Sampling arrangements should preserve containment, exhaust filtration and safety as required for the process.
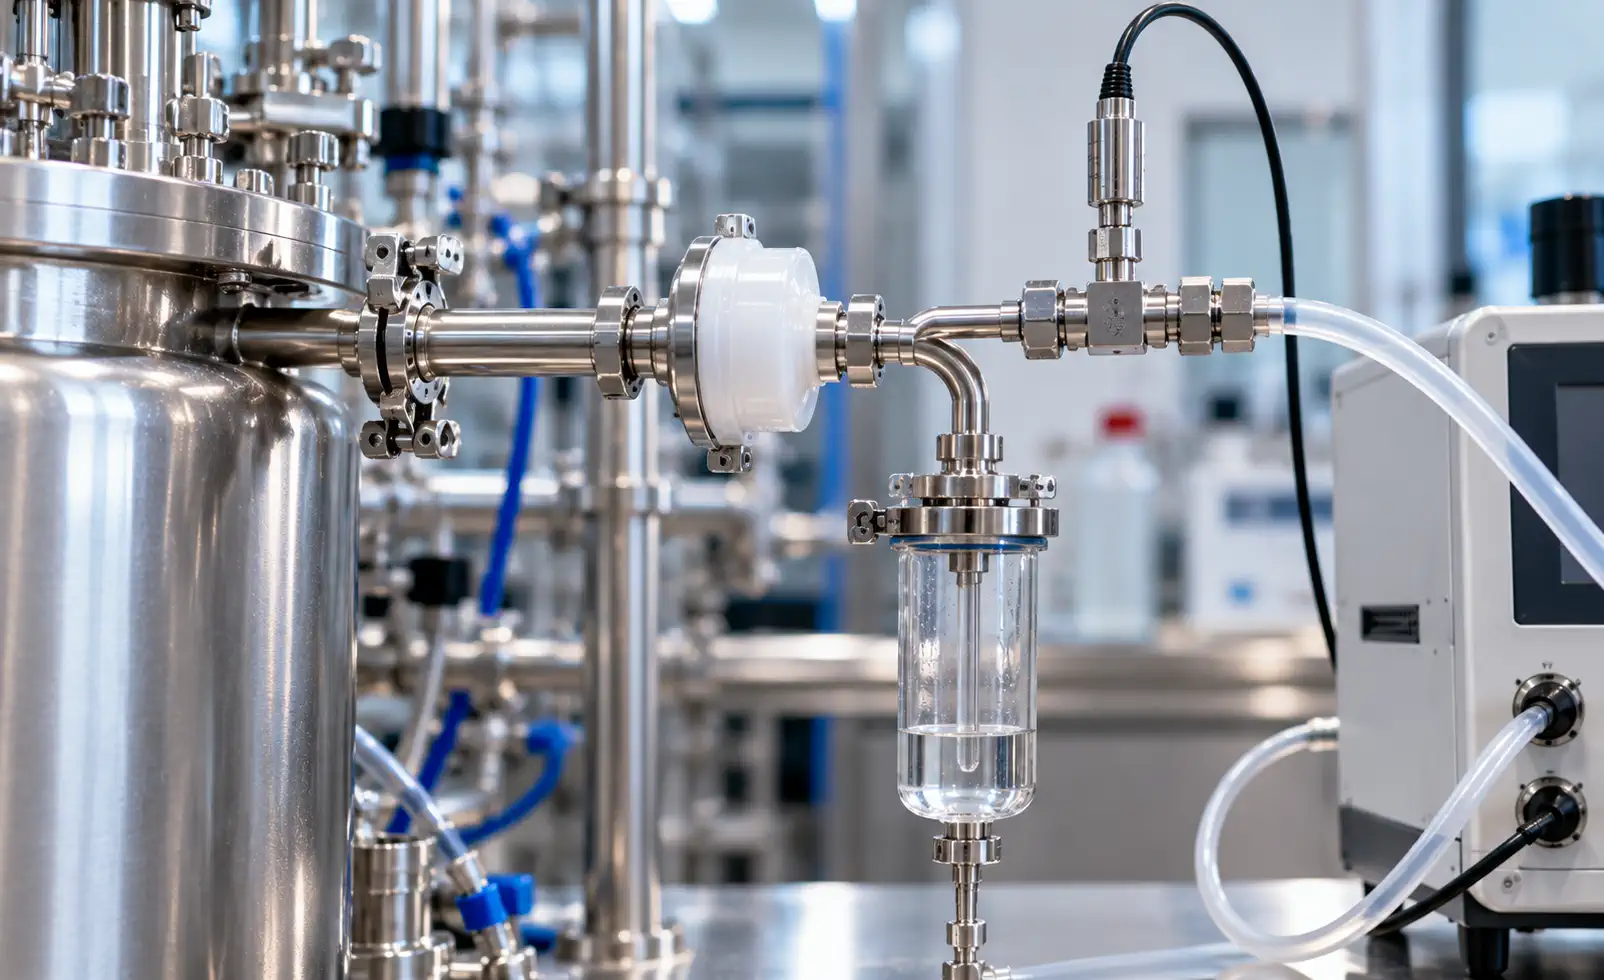
Figure 1. Illustrative exhaust-side filter, sampling and condensate-management components. Not a validated piping diagram or an exact OLLITAL supplied accessory.
Four off-gas patterns worth investigating
1. O₂ falls, CO₂ rises after a feed change
A higher respiratory demand is one possible explanation, especially when the change follows carbon feeding. But start by checking the feed command against actual delivery, the inlet oxygen fraction, airflow and the response of agitation or gas enrichment. If DO also falls, distinguish a rise in oxygen demand from a loss of oxygen-transfer capability. A single simultaneous jump in signals is not enough to isolate a biological cause.
2. CO₂ changes while OUR seems almost flat
Review the carbon source and the liquid-phase carbon chemistry before drawing conclusions about yield. A pH correction step may change CO₂ release from the liquid. Gas-flow changes may affect stripping. Sensor calibration drift and different transport lags can produce an apparent separation between OUR and CER that does not reflect a sudden metabolic shift.
3. DO remains stable as calculated OUR rises
This is not necessarily contradictory. If a DO cascade is active, a vessel may hold its setpoint by increasing aeration, stirring or oxygen enrichment. The better question is whether the equipment retains sufficient operating margin. When controllers reach a limit, the same biological demand can begin to drive DO downward. A time-aligned view of setpoint, actuator output and exhaust data is essential.
4. The RQ spikes or oscillates at low respiration
Division by a small, uncertain OUR magnifies noise. During early cultivation, late stationary phases or temporary gas changes, RQ may fluctuate because the denominator is poorly resolved. Check data quality and the calculation threshold before attributing the pattern to an organism changing its metabolism. If the signal falls outside the method’s valid measurement range, report that limitation rather than forcing a ratio.
A DO trend and an off-gas trend answer different questions
The DO probe tells the operator how much oxygen remains dissolved at its measurement location relative to its calibration scale. Off-gas analysis helps estimate how much oxygen is consumed and CO₂ released through the gas-phase balance. It is possible to have adequate DO with high oxygen uptake if transfer supply keeps pace, just as a low DO can arise from insufficient transfer rather than a uniquely high biological consumption rate.
For a fermentation run, inspect DO alongside airflow, oxygen enrichment, agitation speed, vessel pressure and feed delivery. Then inspect the OUR and CER estimates using the same time axis. In highly dynamic periods, short-term gas accumulation and analyzer transport delays may limit how literally an instantaneous mass balance should be interpreted. Sometimes the most useful result is a trend over an appropriate interval rather than a second-by-second number.
Separate real physiology from delayed instrumentation
A sample travels through tubing and conditioning hardware before the analyzer reports a value. A change in exhaust composition may arrive on the chart later than the stirring or feeding event that created it. Conversely, software integrations can display values under timestamps that do not share the same clock. Without synchronization, an apparent biological lag might simply be a gas-path delay.
Calibration gases, zero/span checks where supported, filter inspection, condensate control, line condition and measurement-range verification are therefore part of the analytics strategy. Calibration frequency and method must follow instrument guidance and the facility’s quality system. Do not replace the manufacturer’s procedure with a generic article setting.
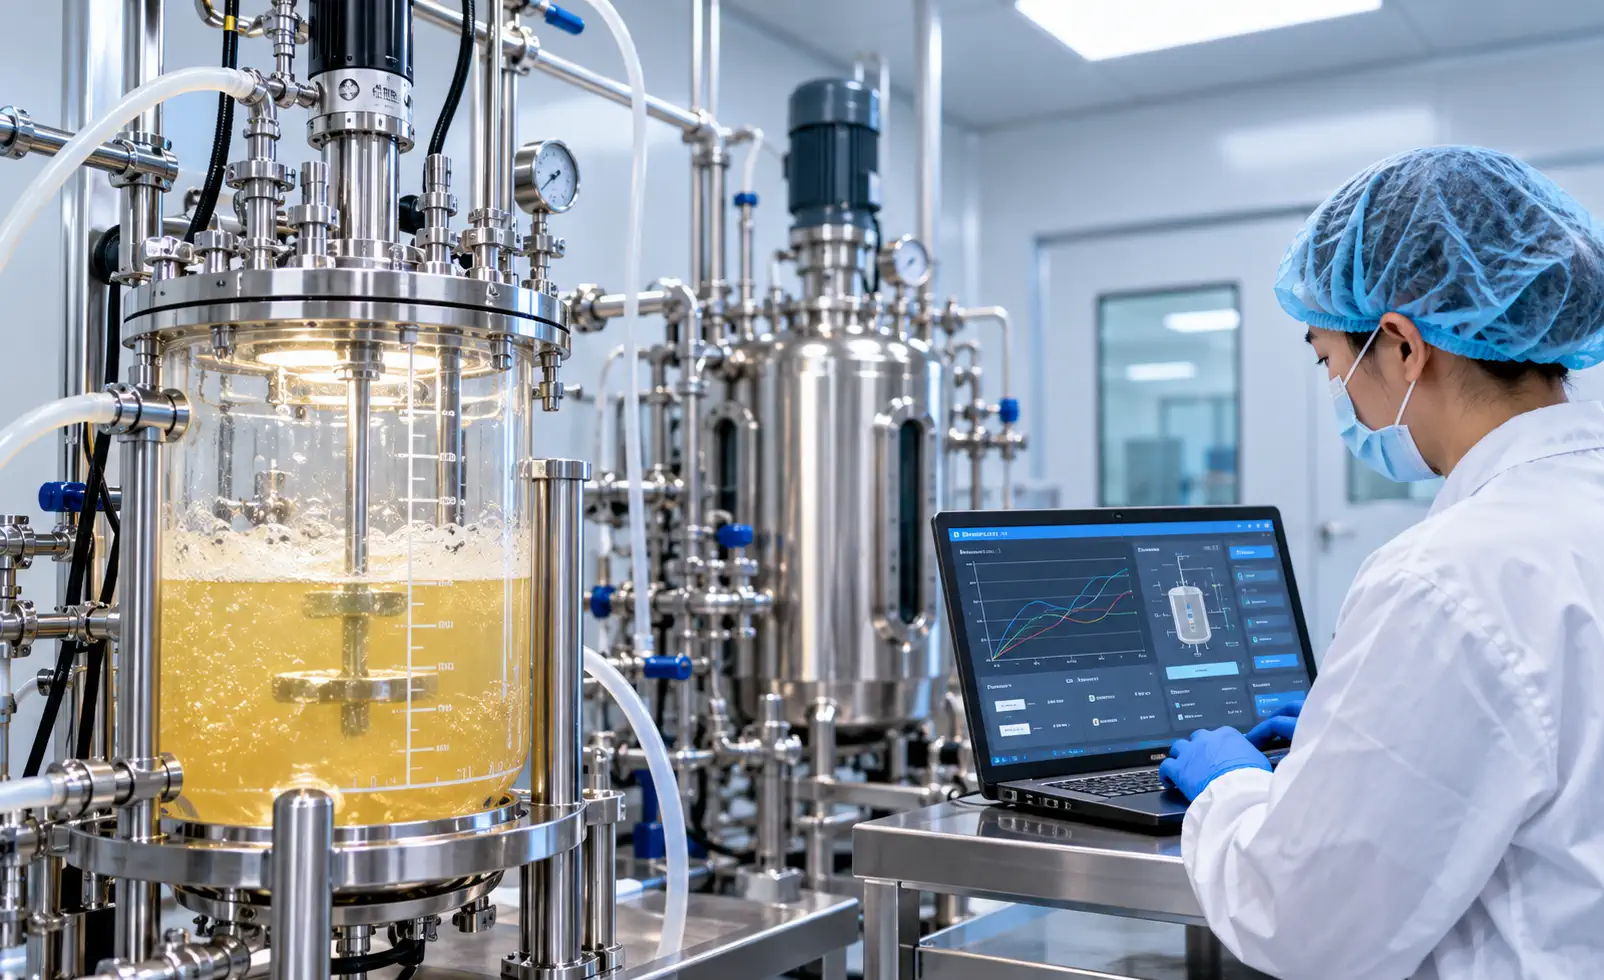
Figure 2. Operator reviewing conceptual bioprocess trends. The illustrated laptop screen is not actual OLLITAL batch data and is not a claimed controller feature.
Off-gas data become useful when the batch record is synchronized
An engineer comparing experiments needs a coherent record of process actions and biological responses. For each phase, keep the intended gas recipe and actual delivery, exhaust analysis status, DO and pH, temperature, mixing, feed changes, sampling times and notable interventions. Use the same time base where possible and annotate instrument calibration or configuration changes. If substrate, biomass, organic-acid or product samples are available, those measurements can help test a gas-derived hypothesis rather than treating the exhaust curve as self-explanatory.
For a process transfer study, record the basis of OUR and CER normalization. Volumetric rates based on liquid volume may change as the working volume grows during fed-batch. Rates normalized to dry cell weight or other biomass estimates answer a different question. A chart that omits units, normalization basis or measurement range can create a false appearance of comparability across vessels and batches.
What should an OLLITAL buyer actually specify?
On the current OLLITAL website the OLT-100-M1 laboratory glass bioreactor and the OLT-100-C2 benchtop bioreactor pages show exhaust detection analysis among optional configurations. The OLT-500-C1 stainless steel bioreactor page likewise lists exhaust detection analysis as an option. These lists establish that off-gas capability can be discussed with the manufacturer; they do not establish that every reactor is shipped with a specific O₂/CO₂ analyzer, sampling module, calculation package or validated performance specification.
Before requesting that option, tell the supplier which organism is being cultivated, the reactor working volume, the gas types, airflow and pressure envelope, whether oxygen enrichment is planned, and which questions the data must answer. A process team estimating OUR/CER during transient fed-batch operation may need different timing, gas-flow measurement and data-export capability from a team simply observing an exhaust O₂ trend.
It is especially important to confirm where conditioning, filters, condensate handling, flow measurement, analyzer calibration and data acquisition fall within the supplier’s scope. A control cabinet’s display of gas concentrations does not by itself demonstrate that the full mass-balance inputs, batch historian or reportable OUR/CER/RQ calculations are included.
Equipment review questions for a serious off-gas specification
| Area | Question that should be answered before the quote |
|---|---|
| Gas channels | Are O₂ and CO₂ both measured? Which ranges and calibration method apply? |
| Sample path | How are moisture, condensate, pressure and sterile exhaust requirements handled? |
| Gas flows | Is inlet composition and flow measured or logged, and how is outlet flow established? |
| Data integrity | Are gas readings aligned with DO, rpm, flow, pH, feed and pressure timestamps? |
| Scope and acceptance | Which parts are supplied, installed, commissioned and checked against agreed criteria? |
When the additional sensor is—and is not—worth the complexity
Off-gas analysis can add real value when a process team needs to distinguish changes in respiration from changes in gas transfer, compare batch physiology or develop a documented scale-transfer strategy. It is less valuable when the measurement lacks the flows, calibration, timing or process samples needed to interpret it. Installing more sensors without specifying the decision they support creates more maintenance and more ambiguous trends, not necessarily more process knowledge.
At OLLITAL, we recommend starting the discussion from the process question: what decision would a trustworthy OUR, CER or RQ signal change? That question clarifies instrument range, sampling requirements, integration, validation effort and expected operating practices.
Conclusion: calculate the rate, then interpret the process
A credible off-gas analysis program does not stop at two exhaust percentages. It accounts for gas balances, sampling quality, instrument timing and the physical reasons DO and exhaust measurements can diverge. OUR and CER are valuable process rates when derived on a consistent basis; RQ becomes useful only when its component rates are trustworthy. These signals are most informative when treated as one part of the complete fermentation record.
Considering off-gas monitoring for your fermentation process? Share your culture type, vessel size, gas-flow range and data requirements with Contact OLLITAL to review a suitable measurement and integration scope.